Fitness, fatigue and form
Fitness, fatigue and form become more useful when you read them as a pattern across weeks. Start with what training load represents, then look at how recent riding sits alongside the longer history.
Available for iPhone
Training load puts effort into context
Training load is a way of summarising the work of a session or period of training. Common approaches consider duration and intensity together: a longer easy ride and a shorter hard session can both contribute meaningful work. The number is an estimate produced by a method, rather than a direct measurement of every change happening in your body.
Distance alone leaves out much of that context. Wind, climbing and the pace you choose can make two rides of similar length feel quite different. When reviewing a week, keep the kinds of riding you did in mind as well as the total you accumulated.
Glood lets you review an activity’s training load and see fitness, fatigue and form over time, calculated from your recorded activities. Read the explanation of fitness, fatigue and form to understand the three figures.
The model behind the three figures
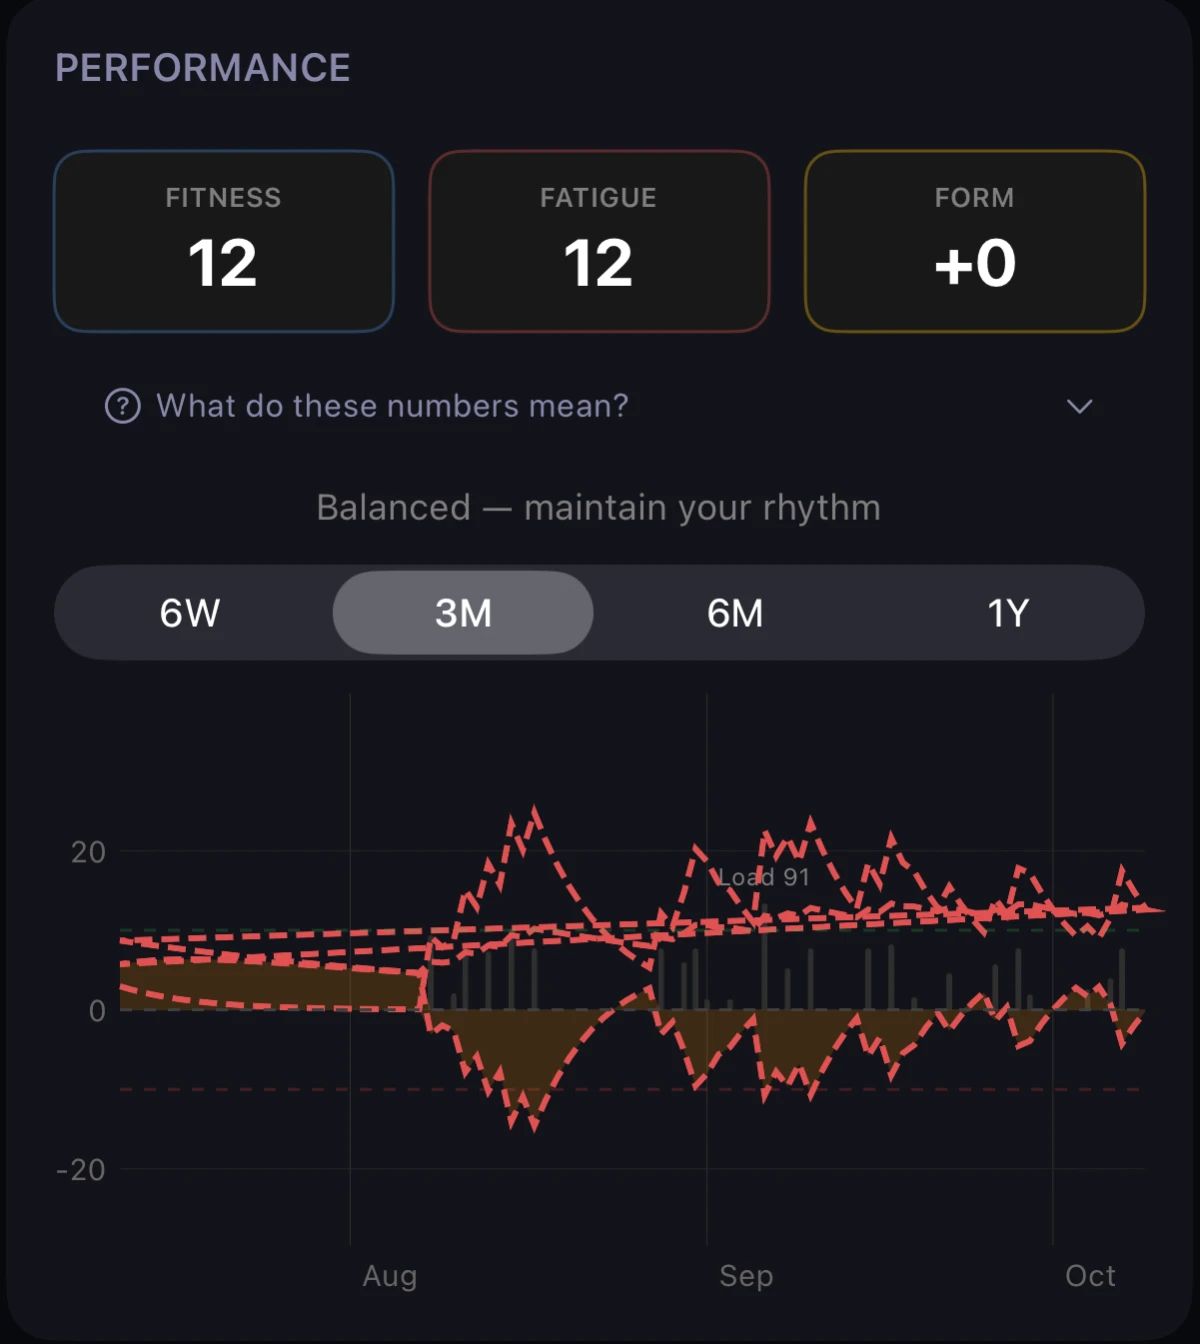
In Glood, fitness is a 42-day exponentially weighted average of daily training load, fatigue is a 7-day one, and form is fitness minus fatigue, so positive form means fresher.
An exponentially weighted average gives more influence to recent data while older contributions gradually fade. The period describes the rate of that fading, rather than a window that abruptly drops everything older than a particular date. A shorter averaging period follows changes more quickly than a longer one.
That difference helps explain why a recent run of demanding rides can change the short-term picture before the longer trend moves much. When training becomes lighter, the shorter average also responds sooner. Read the relationship between the lines, rather than expecting them to rise and fall together every day.
The word fitness in a load model describes accumulated training history. It is not the same thing as a timed climb, a threshold test or the result of an event. Those observations answer different questions about your riding, so keep them alongside the model when judging progress.
Read weeks before judging individual days
Performance in Glood offers a trend chart spanning 6 weeks, 3 months, 6 months or 1 year.
- Start by identifying the period: a building block, an easier week, a break from riding or preparation for an event.
- Look for the recent pattern of work rather than treating a single high-load day as the whole story.
- Compare the chart with your own notes about how rides felt and what else was happening that week.
- Use a wider view to distinguish a brief change from a trend that has continued across several weeks.
A chart can help organise a review, but it cannot supply every reason for a difficult ride. Sleep, illness, stress and conditions sit outside a simple summary of recorded training. If the picture and your experience disagree, investigate the difference rather than assuming the number must be the more complete account.
Keep the record consistent
Any history-based model depends on the activities used to build it. Missing sessions or duplicate entries change that input. Before interpreting an unexpected jump or dip, check whether the underlying record matches the riding you actually did.
Comparisons are also easier when the method stays consistent. Two systems can use different inputs or scales, so matching numbers across apps does not necessarily mean matching work. Concentrate on the pattern within one consistent record before comparing isolated scores from different sources.
When reviewing plans by level and goal, use the recent pattern to frame questions about the next block, not to chase a larger score for its own sake.
Open workouts to read their interval structure, block by block.
Then consider how a session would fit with the work and recovery already around it. A useful review ends with a reasoned choice about the week, rather than an attempt to make every line on the chart move upward.
Questions before your ride
What does positive form mean?
Positive form means fresher in Glood’s model: the fitness value is higher than the fatigue value.
Treat that as context for your recent training, not a promise about how the next ride will feel.
Why can form rise during an easier week?
A shorter weighted average responds to reduced training sooner than a longer one, so the gap between them can change while you ride less. That is a feature of the averaging method, not proof that one easy day has transformed your ability.
Can I compare the figures with another rider’s?
Not as a complete comparison of ability. A training-history score depends on the data and method behind it; similar values do not establish that two riders will perform alike on a climb or in an event.